Firsts and Worsts: Four Reasons Why 2022 Won't Happen Again
In 2022, numerous unprecedented events led to a decline in asset prices across all markets, resulting in an historic decline in global investment wealth. This scenario is unlikely to reoccur for four primary reasons, which we discuss below.
Key Takeaways:
- 2022 was an historically bad year: the worst in centuries for bonds, and the first time in history when both stocks and bonds were in a bear market.
- 2023 yields are currently much higher than in 2022, with lower interest rate sensitivity and higher expected bond returns.
- 2022 saw a record number of down days, and nearly all asset classes experienced losses.
- 2022 defied all expectations, including those of the Fed.
Worst Year for Bonds
Bond losses in 2022 were historic. US Treasury bonds had their worst year since the birth of the nation. 20-Year US government bonds lost 29%, and 10-Year US lost over 12% as shown in the chart below. Even typically low volatility short Treasurys and mortgage-backed securities lost 4% and 12% respectively.
International bonds performed just as poorly. The Global Aggregate Bond Index had its worst year since its inception and UK bonds had their worst returns in 400 years.
Annual Returns of 10-Year US Treasury Bonds (1871-2022)
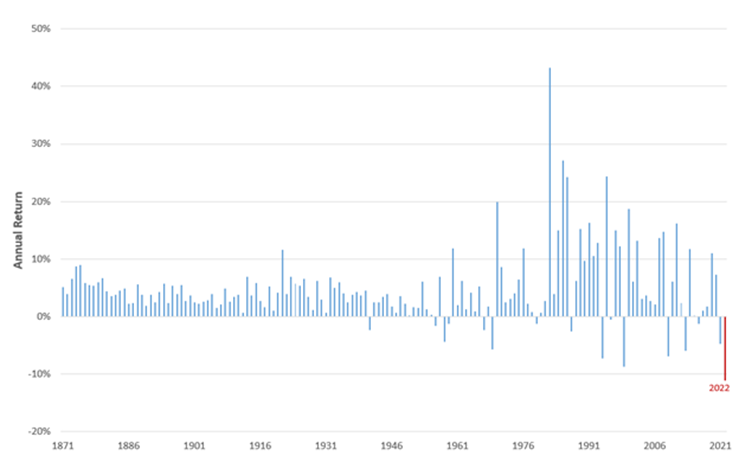
Source: Returns are based on data developed and shared by Robert J. Shiller.
The First Simultaneous Bear Market for Global Stocks and Bonds
This was not just the worst year ever for bonds, but also, for the first time in history, both global stocks and bonds were simultaneously in a bear market. Things weren’t much better in the U.S., where both large-cap stocks and long-term bonds had losses of more than 15% in the same calendar year. Compared to other years when bonds still provided recession-risk hedging to portfolios, 2022 challenged the accepted wisdom on the safety of a balanced portfolio.
Annual Return of Large-Cap Stocks and Long-term Bonds from 1926-2022
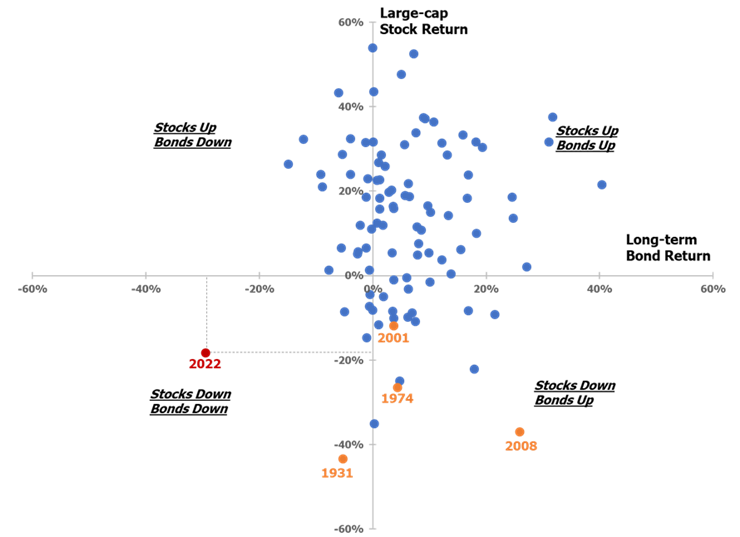
Source: Large-cap stock returns represents Ibbotson SBBI US Large-Cap Stocks (Total Return). Long-term bond returns represent Ibbotson SBBI US Long-term (20-Year) Government bonds (Total Return)
The 60% Stock, 40% Bond Portfolio Suffered
To illustrate how this past year would have impacted a typical investor, we show how the returns of stocks and bonds in a 60/40 US large-cap stocks/ 20-Year US government bonds portfolio combine for a 60/40 portfolio. This 60/40 portfolio, representative of an average balanced portfolio, was down ~23% during 2022, the worst year for balanced portfolios since 1931.
Annual 60/40 Portfolio Returns (1926-2022)
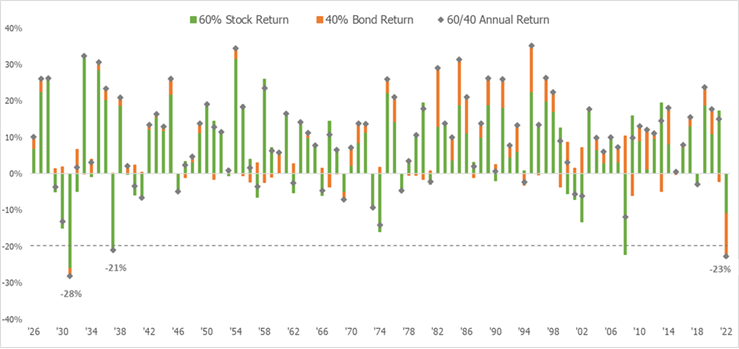
Source: Ibbotson and New Frontier Advisors LLC. Stock returns represent Ibbotson SBBI US Large-Cap Stocks (Total Return). Bond returns represent Ibbotson SBBI US Long-term (20-Year) Government bonds (Total Return)
Losses Were Pervasive
Stocks and bonds were not the only assets to suffer in 2022; almost all financial assets had losses as central banks fought inflation. Many asset classes that are considered to have inflation protection lost value. TIPS (Treasury Inflation Protected Securities) lost nearly as much as Treasury securities of the same maturity, and real estate was one of the worst-performing major asset classes in 2022. Although commodities broadly performed well in the first half of the year, their performance did not continue into the second half and only energy remained notably positive for the year. Investors had no place to hide.
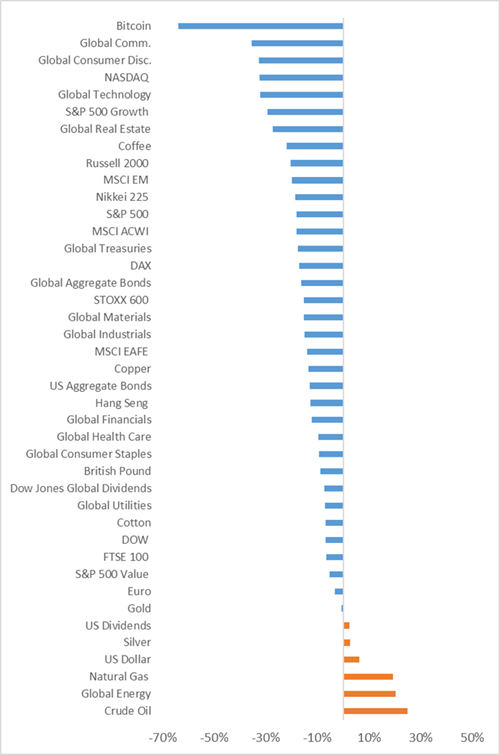
Source: 2022 annual returns of major indices from Bloomberg.
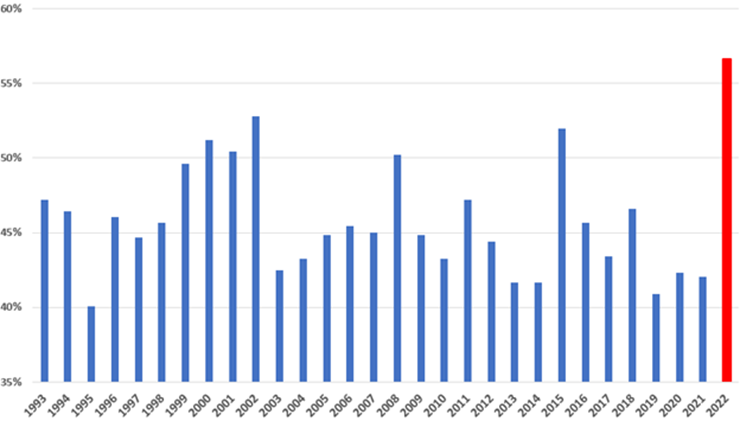
Record Number of Down Days for Stock Market: 2022 Had Many Negative Surprises
2022 was a year of negative surprises. To illustrate this, we look at daily returns for the market and count the number of days where the market declined, since market declines often correspond to a negative surprise. We see that 2022 had the most down market days in over 30 years. In 2022, the S&P 500 recorded ~56% of trading days as negative which is the highest in any of the last 30 years, relative to the historical level of ~45%. Even 2008 had only 50.1% down days.
Percentage of Negative Trading Days for SPDR S&P 500 ETF (SPY) in 2022
Source: Bloomberg and New Frontier Advisors, LLC.
Nearly Everyone Was Wrong About 2022
Though it may seem obvious now, the collapse of the bond market in 2022 was not obvious enough for markets, bond experts, or the Fed to predict. Only 1% of bond managers had a positive year in 2022 (Bloomberg: of 198 bond funds with at least $1 billion in assets, only 2 had positive returns).
Markets massively underpriced the risk of rising rates and Fed forecasts were no better.
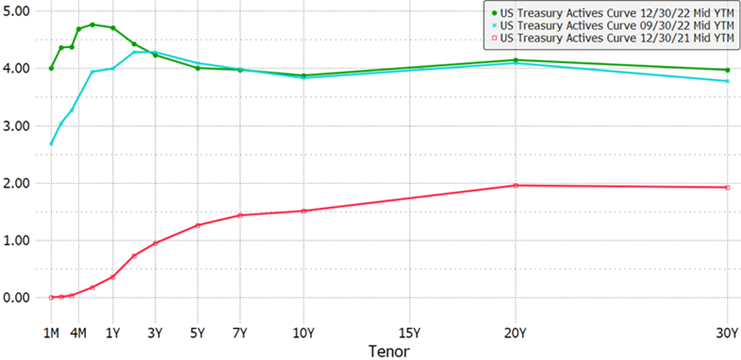
The yield curve maps out future interest rates. It holds a wealth of information – including interpretations of Fed announcements, minutes, and other communications – which are immediately and vigorously priced in by markets. But while the entire yield curve is a market expectation representing the equilibrium beliefs of many investors, it’s unlikely to chart the exact path of the Fed policy. As can be seen in the graph below, while the yield curve currently shows rates peaking mid-year and then falling (e.g., the possibility that the Fed will change course as new data arrives showing the economy slowing more than the Fed desired), this is only one of many possibilities.
The chart shows the entire Treasury yield curve rose dramatically in the first nine months of last year. This was not expected by any member of the Fed, whose highest forecast for rates was 1.25% by the end of 2022.
2022 Yield Curve
Source: Bloomberg
2023 - Higher Yields, Less Risk, More Expected Return
Higher rates in 2023 mean both lower sensitivity to potential interest rate changes as well as higher expectations for the future.
Duration decreases with higher yields, as more cashflow is paid earlier. For example, for a 30-year maturity bond with a 2% coupon and yield to maturity (YTM), duration comes out to 22.8 years. Whereas a 30-year bond with a 5% yield has only 16.1 years duration, or 29.4% less interest rate sensitivity. The cash flows in both scenarios are illustrated in the graphs below. Though this example is somewhat extreme, duration and interest rate sensitivity will be lower in 2023 with today’s higher rates.
Annual Cash Flows of 30-Year, 2% Coupon Bond (log-scale)
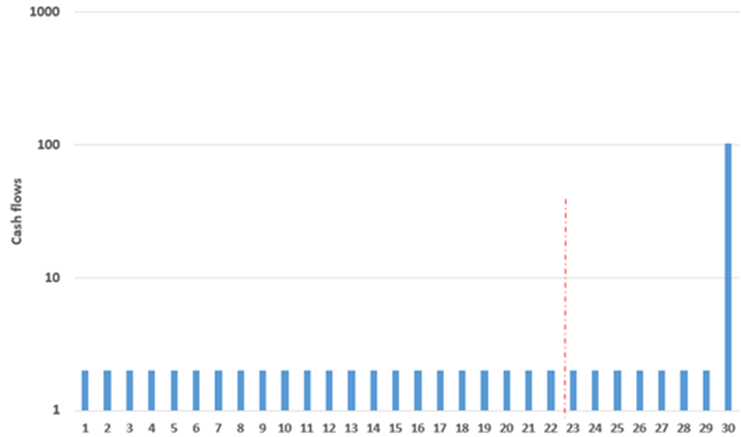
Note: 30-Year 2% Coupon bond, 2% YTM has duration of 22.8 years.
Annual Cash Flows of 30-Year, 5% Coupon Bond (log-scale)
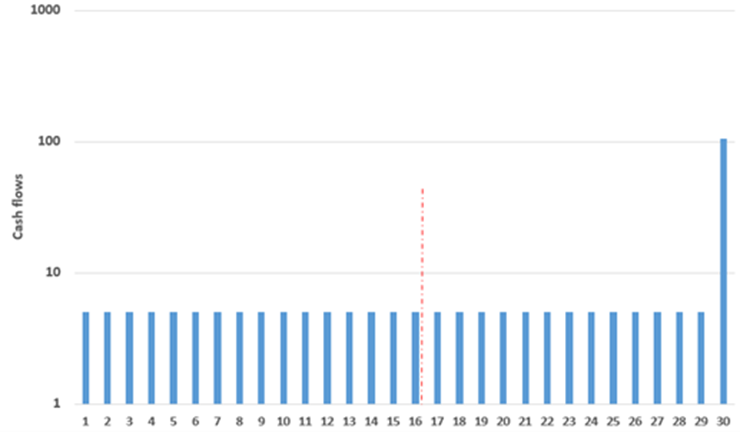
Note: 30-Year 5% coupon bond, 5% YTM has duration of 16.1 years.
Source: New Frontier Advisors LLC.
There is a strong correlation between the current yields of bonds and their subsequent n-year returns. According to our analysis based on Ibbotson SBBI US Long-term (20-Year) Government bonds from 1926 to 2001, there is a 95% correlation between the starting yield of 20-year US Government bonds and their subsequent 20-year nominal returns. As observed in the chart below, starting yield closely tracks subsequent returns in many observations, even if there are small variations around the best-fit line. This suggests that the starting yield is a good predictor of subsequent returns. In addition to having lower duration, bonds also have a higher expected return going into 2023.
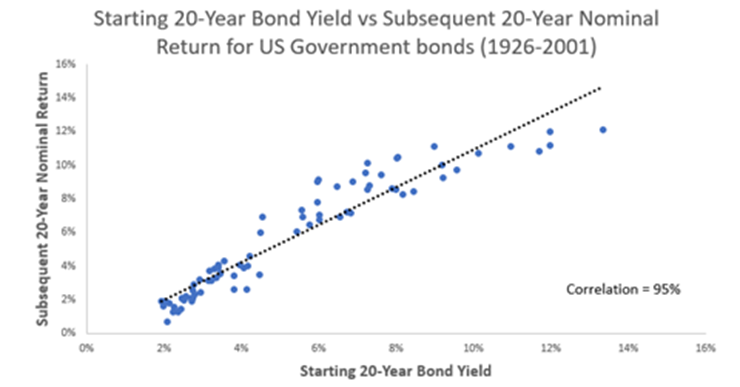
Source: New Frontier Advisors LLC, using Ibbotson SSBI US Long-term (20-Year) Government bonds data.
2022 Won't Happen Again in 2023
We don’t know the future. 2022 proved markets move in ways no one can predict; there is no crystal ball for investors. It’s important to remember there is always risk in markets – especially with equities. Stocks and bonds will go up and down in 2023 - as they did in 2022 - but this year is already at a better starting point for three reasons:
First, bonds have more cushion. Improvement is expected for bond performance as the Fed’s anticipated interest rate hikes are unlikely to be as rapid and the impact on bonds unlikely to be as dramatic; even if rates rose as much in 2023 as they did in 2022, the higher starting point for rates would lead to smaller losses. Second, correlation between stocks and bonds is likely to be lower, which lowers the volatility of diversified portfolios such as a 60/40 portfolio. Finally, with much of the risk of recession already priced in to markets, the relationship between risk and return will likely be closer to historical norms, so advisors should ensure clients are in the right portfolio for their long-term goals. While assuming greater risk can mean greater negative returns, in 2023 there are some high risk and return funds that are worthy investments. In such cases, these funds can be managed within a portfolio through appropriate diversification and quantitative risk management.
Disclosures:
New Frontier Advisors LLC (“New Frontier”) is a federally registered investment adviser based in Boston, MA. The information discussed here is for information purposes only. Past performance does not guarantee future results. As market conditions fluctuate, the investment return and principal value of any investment will change. Diversification may not protect against market risk. There are risks involved with investing, including possible loss of principal. Before investing in any investment portfolio, the investor and Financial Advisor should carefully consider the investor’s investment objectives, time horizon, risk tolerance, and fees.
comments powered by Disqus
Locate Us
New Frontier Advisors
155 Federal Street
Boston, MA 02110
617.482.1433
Contact us to find out how you can invest in New Frontier portfolios.